Debugging
Scala.js supports source maps, making debugging your code in the browser quite easy. You can set breakpoints in the original source-code and inspect local variables etc. just like in a real IDE debugger. See the documentation for your browser developer tools for more information.
Setting source maps
Play Scala.js plugin will automatically copy the source maps into correct location.
Actual debugging
When running the application, you can access the sources through the developer tools window as shown below.
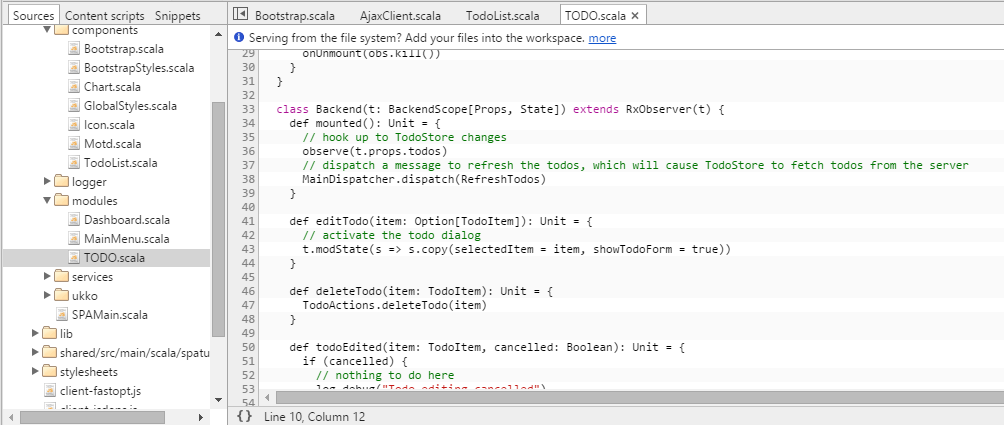
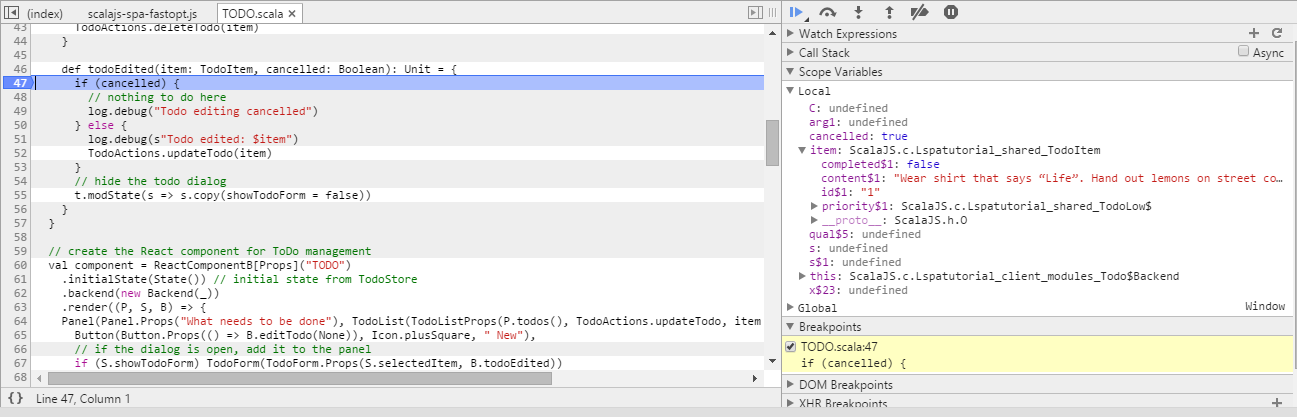
You can set breakpoints and investigate variables to see what's going on in your code. Some of the variable names have funny extensions like completed$1
but this is just due to name mangling by Scala. Below you can see how the debugger has hit a breakpoint and the local variables are displayed automatically.
You might also want to install Facebook React DevTools into your Chrome browser to help visualize active React components in the DevTools window.